Graham Scan
It only took me four months but here we go, first entry of 2021! For this long break I’m blaming the slightly addicting Zelda Breath of the Wild Switch game, which I started to explore earlier this year and couldn’t quite get myself out of. Now that Ganon is defeated and peace restored in Hyrule, I find myself with more time to get back to studying and writing.
Since I read through so much of Introduction to Algorithms last year, I figured I might as well close the arc and finish the remaining chapters before I take on something new. Last one to date was “computational geometry” which covers various 2D geometry algorithms such as finding the pair of two closest points or the convex Hull for a given set of points. Something quite enjoyable with these is that, similarly to graph algorithms, they are well suited for visual representation. That inspired me to take a shot at implementing one of them and try to generate some kind of visual output.
I’ve settled on Graham scan, which is one of the two techniques (along with Jarvis March) presented to find the convex Hull for a set of points.
The convex Hull problem
Formally, the convex hull of a set Q of points is the smallest convex polygon P for which each point in Q is either on the boundary of P or in its interior. So if you think of the smallest possible shape that encompasses all of the points in Q, the convex hull is the “border” of that shape.
Here are, roughly, the four steps of Graham scan:
- let p0 be the point with the min y coordinate
- sort the remaining points by polar angle counterclockwise order around p0
- initialise a stack with p0 and the first two points of the polar angle-sorted points
- iterate over remaining points, and for each of them:
- while you form a non left turn, pop from the stack
- append point to the stack
When you stop iterating, remaining points in the stack form the convex hull.
Finding whether you are taking a “left turn” in step 4.1 can be done through calculating the cross product between the vector formed by the second to last and last point on the stack, and the vector formed by the last point on the stack and current point. In 2D geometry this is given by the expression P = (p1 - p0) x (p2 - p0) = (x1 - x0)(y2 - y0) - (x2 - x0)(y1 - y0).
Graham Scan implementation in Python
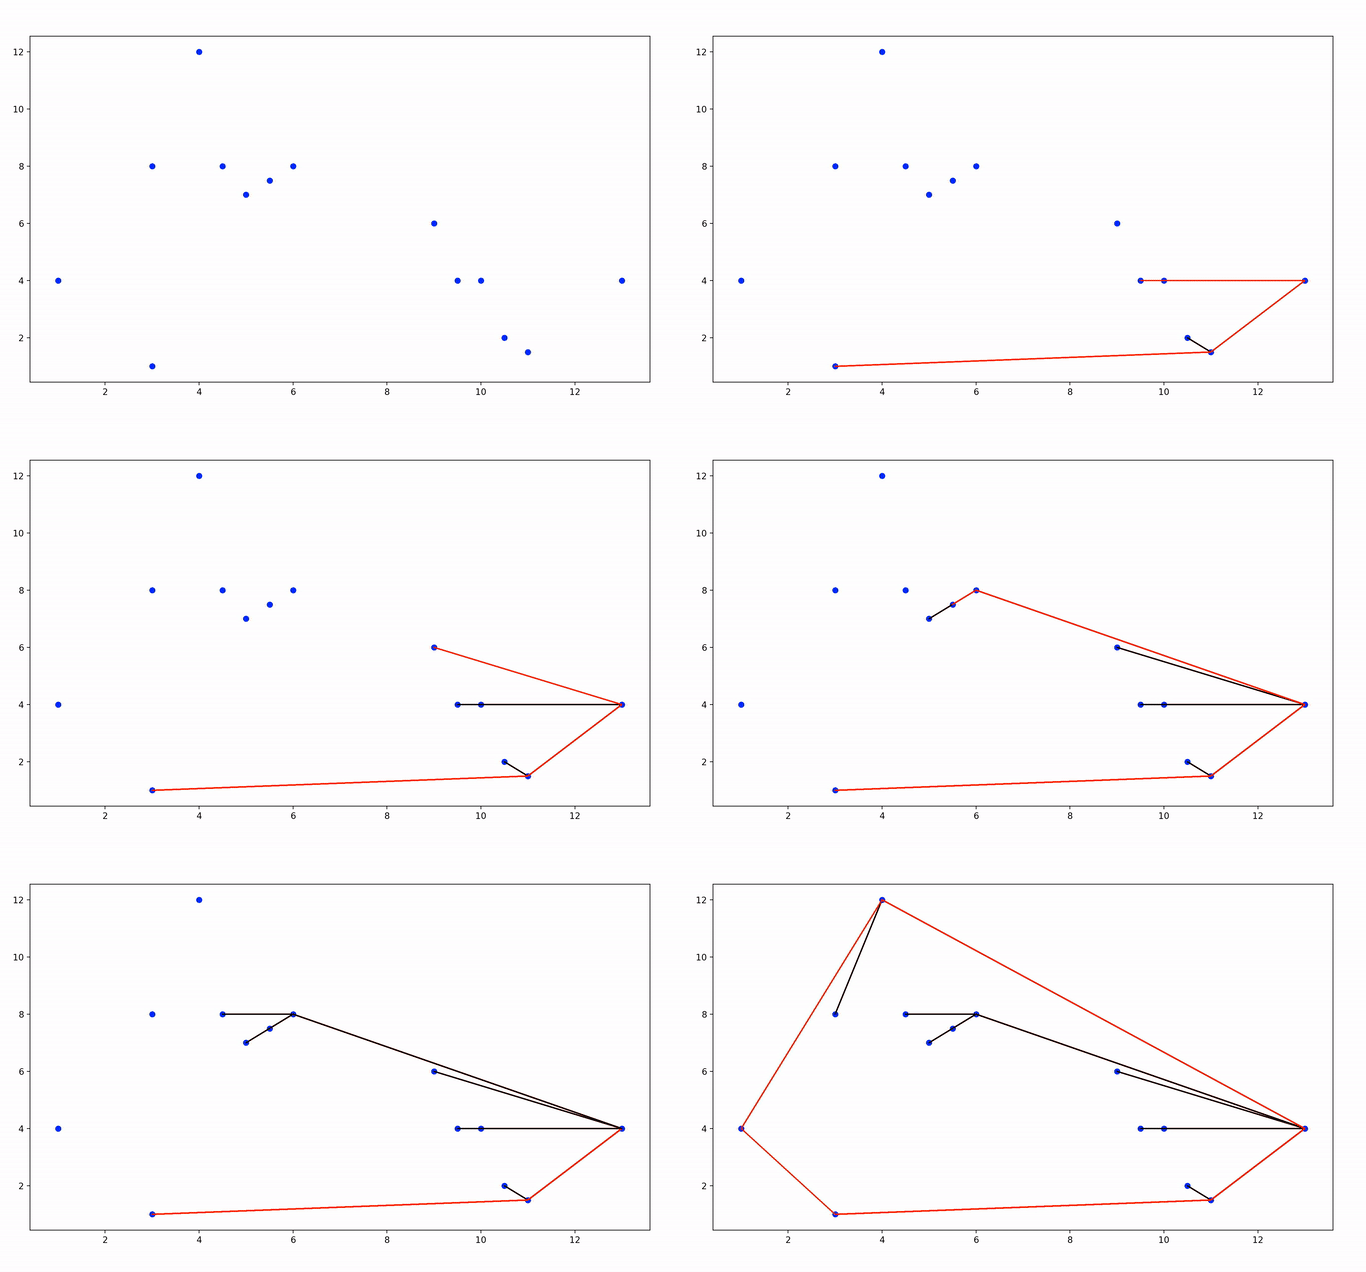
Here’s my implementation in Python, in which I’m also plotting the figure on a 2D plane with a visualisation of the algorithm breakdown. I used mathplotlib for that last part.
I was pleasantly surprised that the whole thing fitted under 100 lines, boilerplate and all. I guess that’s Python for you!
#!/usr/bin/env python

from collections import deque, namedtuple
from matplotlib import pyplot
from numpy import arctan2
from typing import Deque, List, Union

Point = namedtuple('Point', ['x', 'y'])


def polar_angle(p0: Point, p: Point) -> float:
    return arctan2(p.y - p0.y, p.x - p0.x)


def is_non_left_turn(p0: Point, p1: Point, p2: Point) -> bool:
    cross_product = (p1.x - p0.x) * (p2.y - p0.y) - (p2.x - p0.x) * (p1.y - p0.y)
    if cross_product < 0:
        return True
    return False


def plot_points(points: Union[List[Point], Deque[Point]], style: str) -> None:
    xs, ys = zip(*points) #create lists of x and y values
    pyplot.plot(xs, ys, style)
    pyplot.pause(0.5)


def gray_out_last_segment(points: Deque[Point]):
    plot_points([points[-2], points[-1]], 'k-')


def graham_scan(points: List[Point]) -> Deque:
    # let p0 be the point with the min y coordinate
    p0 = min(points, key = lambda p: p.y)

    #  sort points by polar angle counterclockwise order around p0
    points.sort(key=lambda p: polar_angle(p0, p))

    stack = deque()
    stack.append(points[0])
    stack.append(points[1])
    stack.append(points[2])

    for i in range(3, len(points)):
        plot_points(stack, 'r-')
        while is_non_left_turn(stack[-2], stack[-1], points[i]):
            plot_points(stack, 'r-')
            gray_out_last_segment(stack)
            stack.pop()
        stack.append(points[i])

    plot_points(stack, 'r-')

    return stack


def main():
    points = [
        Point(1, 4),
        Point(3, 1),
        Point(3, 8),
        Point(4, 12),
        Point(4.5, 8),
        Point(5, 7),
        Point(5.5, 7.5),
        Point(6, 8),
        Point(9, 6),
        Point(9.5, 4),
        Point(10, 4),
        Point(10.5, 2),
        Point(11, 1.5),
        Point(13, 4)]

    plot_points(points, 'bo')
    convex_hull = graham_scan(points)

    # repeat the first point to create a "closed loop"
    convex_hull.append(convex_hull[0])
    plot_points(convex_hull, 'r-')

    pyplot.show()


if __name__ == "__main__":
    main()
And now, let’s watch this piece of code at work!
Candidate segments for the convex hull are displayed in red, and discarded segments in black.
